Aporras1 Week 14
User page: Antonio Porras
Team page: JASPAR The Friendly Ghost
Assignment page: Week 14
Contents
Electronic Lab Notebook
Edits to Week 8 & 10
Made edits in the Week 8 and Week 10 electronic notebooks and journal entries in accordance to the feedback given from Dr. Dahlquist and Dr. Dionisio.
- Edits to: Week 8
- Provided exact formulas used in excel.
- Made sure tense was consistent throughout the electronic notebook.
- Corrected powerpoint provided by supplying correct values.
- Extended concluding paragraph.
- Acknowledged source of data and specified acknowledgements.
- Edits to: Week 10
- Included specific filenames.
- Reported definitions for 6 GO terms.
- Interpreted GO terms in terms of cold shock.
- Updated references to include GO term definitions.
- Updated acknowledgements to specify instructions were copied and modified from Week 10 assignment page.
- Included the excel file used for the stem.
- Included the .txt file that was used for the stem.
- Added summary paragraph to the end of the journal entry.
Using YEASTRACT to Infer which Transcription Factors Regulate a Cluster of Genes
- Opened the gene list in Excel for profile 22 from my stem analysis.
- Gene list Excel file for profile 22 dZAP1: Media:AP dZAP1 profile22 genelist.xlsx
- Copied the list of gene IDs onto my clipboard.
- Launched a web browser and went to the YEASTRACT database.
- On the left panel of the window, clicked on the link to Rank by TF.
- Pasted the list of genes from profile 22 into the box labeled ORFs/Genes.
- Checked the box for Check for all TFs.
- Accepted the defaults for the Regulations Filter (Documented, DNA binding plus expression evidence)
- Did not apply a filter for "Filter Documented Regulations by environmental condition".
- Ranked genes by TF using: The % of genes in the list and in YEASTRACT regulated by each TF.
- Clicked the Search button.
- Questions:
- How many transcription factors are green or "significant"?
- 49 transcription factors are green or significant.
- 13 transcription factors are yellow or borderline significant.
- 125 transcription factors are pink or insignificant.
- Copied the table of results from the web page and pasted it into a new Excel workbook.
- Uploaded the Excel file and saved it as "AP YEASTRACT Transcription Factors"
- Is dZAP1 transcription factor on the list? If so, what is their "% in user set", "% in YEASTRACT", and "p value".
- dZAP1p is on the list.
- 43.03% in user set
- 7.02% in YEASTRACT
- p-value: 2E-15
- dZAP1p is on the list.
- Chose the listed transcription factors from the 49 "significant" TFs and selected 20 with the highest value of "% in user set" because they target a high percentage of the genes within my dataset. Also included two transcription factors, GLN3 & HAP4 as directed by the Week 10 instructions. List of "significant" transcription factors used to run the model:
- GLN3
- HAP4
- Ace2p
- Sfp1p
- Bas1p
- Msn2p
- Yap1p
- Ash1p
- Gcn4p
- Msn4p
- Abf1p
- Cst6p
- Sok2p
- Rpn4p
- Hsf1p
- Zap1p
- Cin5p
- Aft1p
- Spt23p
- Pdr1p
- Met4p
- Arr1p
- Went back to the YEASTRACT database and followed the link to Generate Regulation Matrix.
- Copied and pasted the list of transcription factors I identified above into both the "Transcription factors" field and the "Target ORF/Genes" field.
- Used the "Regulations Filter" options of "Documented", "Only DNA binding evidence"
- Clicked the "Generate" button.
- In the results window that appeared, clicked on the link to the "Regulation matrix (Semicolon Separated Values (CSV) file)" that appeared and saved it to my Desktop.
- Uploaded file to wiki as: Media:AP Regulation Matrix profile22 dZAP1.xlsx
- How many transcription factors are green or "significant"?
Visualizing Your Gene Regulatory Networks with GRNsight
- Opened the file, Media:AP Regulation Matrix profile22 dZAP1.xlsx, in Excel.
- Fixed formatting:
- Selected the entire Column A. Then went to the "Data" tab and selected "Text to columns". In the Wizard that appears, selected "Delimited" and clicked "Next". In the next window, selected "Semicolon", and clicked "Next". In the next window, left the data format at "General", and clicked "Finish".
- Known as an "adjacency matrix." If there is a "1" in the cell, that means there is a connection between the trancription factor in that row with that column.
- Saved this file in Microsoft Excel workbook format (.xlsx).
- YEASTRACT Adjacency Matrix: Media:AP Adjacency Matrix profile22 dZAP1.xlsx
- Checked to see that all of the transcription factors in the matrix are connected to at least one of the other transcription factors by making sure that there was at least one "1" in a row or column for that transcription factor.
- No transcription factors were deleted as all had at least "1" in a row or column for that transcription factor.
- Inserted a new worksheet into the Excel file, Media:AP Adjacency Matrix profile22 dZAP1.xlsx. and named it "network". Went back to the previous sheet and selected the entire matrix and copied it. Went to the new worksheet and clicked on the A1 cell in the upper left. Selected "Paste special" from the "Home" tab. In the window that appears, checked the box for "Transpose".
- Deleted the "p" from each of the gene names in the columns. Adjusted the case of the labels to make them all upper case.
- In cell A1, copied and pasted the text "rows genes affected/cols genes controlling".
- Alphabetization:
- Selected the area of the entire adjacency matrix.
- Clicked the Data tab and clicked the custom sort button.
- Sorted Column A alphabetically, excluding the header row.
- Sorted row 1 from left to right, excluding cell A1. In the Custom Sort window, clicked on the options button and select sort left to right, excluding column 1.
- Named the worksheet containing your organized adjacency matrix "network" and Save.
- Went to the GRNsight home page.
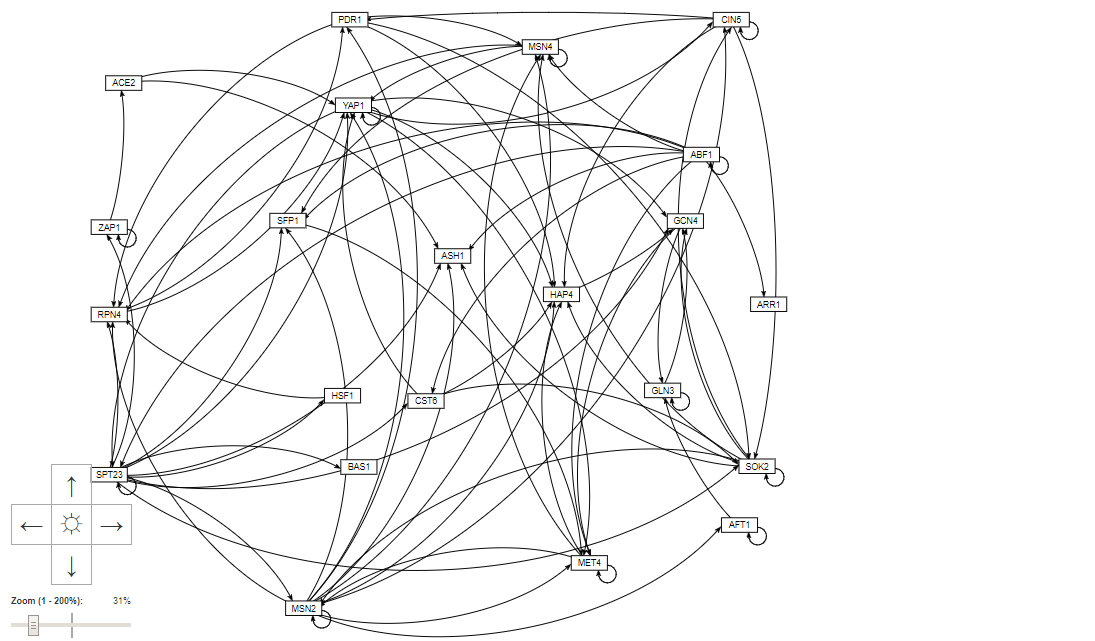
- Selected the menu item File > Open and selected "Media:AP Adjacency Matrix profile22 Network dZAP1.xlsx" file that has the "network" worksheet. Moved the nodes (genes) around until I created a layout I liked and took a screenshot of the results and saved the screenshot as "Media:AP Regulation Matrix profile22 GRNsight Network.PNG"
Summary Paragraph
For Week 14, I was assigned the task of making edits to Week 8 and Week 10 along with completing the remaining parts of Week 10. First, I selected the profile22 genelist and ranked the transcription factors using YEASTRACT and found that 49 of the transcription factors were significant. I further ranked those transcription factors from the lowest p-value to the highest p-value and chose the 20 lowest p-values. Two other transcription factors, HAP4 and GLN3 were including per instructions. These selected transcription factors listed above were put into the YEASTRACT database to generate a regulation matrix. This regulation matrix was then used to create a regulation network from GRNsight to visualize the regulation between these transcription factors. This proves extremely helpful as a method of visualization the connections and ways that the transcription factors interact and regulate each other and even regulate themselves.
Deliverables
- YEASTRACT Transcription Factor Data: Media:AP YEASTRACT Transcription Factors.xlsx
- YEASTRACT Regulation Matrix Profile: Media:AP Regulation Matrix profile22 dZAP1.xlsx
- YEASTRACT Adjacency Matrix: Media:AP Adjacency Matrix profile22 dZAP1.xlsx
- YEASTRACT Adjacency Matrix with Network for GRNsight: Media:AP Adjacency Matrix profile22 Network dZAP1.xlsx
- Screenshot of GRNsight Regulatory Network:


Acknowledgements
- Recieved help from both Dondi and Dr. Dahlquist from feedback given and instructions given in class.
- Copied and modified the instructions from Week 10.
- Texted the data analyst group chat for questions including: Mary Balducci, Dina Bashoura, and Emma Tyrnauer.
While I worked with the people noted above, this individual journal entry was completed by me and not copied from another source.
Aporras1 (talk) 16:53, 28 November 2017 (PST)
References
- Dahlquist, K. D., Dionisio, J. D. N., Fitzpatrick, B. G., Anguiano, N. A., Varshneya, A., Southwick, B. J., & Samdarshi, M. (2016). GRNsight: a web application and service for visualizing models of small-to medium-scale gene regulatory networks. PeerJ Computer Science, 2, e85.
- LMU BioDB 2017. (2017). Week 14. Retrieved November 28, 2017, from https://xmlpipedb.cs.lmu.edu/biodb/fall2017/index.php/Week_14
- LMU BioDB 2017. (2017). Week 8. Retrieved November 29, 2017, from https://xmlpipedb.cs.lmu.edu/biodb/fall2017/index.php/Week_8
- LMU BioDB 2017. (2017). Week 10. Retrieved November 29, 2017, from https://xmlpipedb.cs.lmu.edu/biodb/fall2017/index.php/Week_10
- Teixeira, M. C., Monteiro, P. T., Guerreiro, J. F., Gonçalves, J. P., Mira, N. P., dos Santos, S. C., ... & Madeira, S. C. (2013). The YEASTRACT database: an upgraded information system for the analysis of gene and genomic transcription regulation in Saccharomyces cerevisiae. Nucleic acids research, 42(D1), D161-D166.