Gene Database Project Deliverables
| Gene Database Project Links | |||||||
|---|---|---|---|---|---|---|---|
| Overview | Deliverables | Reference Format | Guilds | Project Manager | GenMAPP User | Quality Assurance | Coder |
| Teams | Heavy Metal HaterZ | The Class Whoopers | GÉNialOMICS | Oregon Trail Survivors | |||
Contents
Group Report
These guidelines are based on the Instructions for Authors issued by the PeerJ Computer Science journal. We have made this choice so that, if a group report is considered to be of sufficient quality, we can pursue publication of this report in PeerJ Computer Science as smoothly as possible. If there are formatting or detail questions that are not covered here, visit the Instructions for Authors and follow their guidance.
- The report should be written with contributions from all group members.
- Submit as .doc, .docx or .pdf file.
Style Sheet
Use the following guidelines when formatting your report:
- 2.54 cm (1 in) margins on all sides
- Double-spaced
- 12 point Times/Times New Roman font
- Number the pages on the lower-right corner
- Use left justification (“jagged” on the right side)
Cover Page
Include the following information in a standalone cover page:
- A descriptive title for your project
- The function of the title is to identify the main result or take-home message of the paper. It should be as specific as possible and name the organism. It can be a phrase or a sentence. What is the main result of your paper that you want to convey with the title?
- The names of the team members (with middle initials)
- The course number and title of the class
- The date of submission
Abstract
Provide an abstract of no more than 500 words.
Introduction
The introduction gives the background information necessary to understand your report. The introduction should be in the form of a logical argument that “funnels” from broad to narrow:

- States importance of the problem
Why is this species important?
- States what is known about the problem
- Give an overview of what is known about your species' genome from your journal club outline and presentation.
- Introduce the DNA microarray experiment that was performed on your species from your journal club outline and presentation.
- States what is unknown about the problem
You want to analyze the data with GenMAPP/MAPPFinder, but can't because there is no Gene Database for your species.
- States clues that suggest how to approach the unknown
Introduce XMLPipeDB and GenMAPP Builder as the answer to this problem.
- States the question the paper is trying to address
In this case you want to discover new information about the microarray data using GenMAPP.
Materials & Methods
This section will summarize the entire workflow for the project. This needs to be a narrative description of what your team actually did, but not a step-by-step protocol. We are following the standards of reproducible research such that someone else with the appropriate expertise could reproduce what you did given the information in your Materials and Methods section. You can consider your audience to be the fellow members of your class.
- Download the UniProt XML proteome set and GOA (GO association) files for your species.
- Note the date of download and the version of the files.
- Download GO terms from in the OBO-XML format.
- Note the date of download and the version of the files.
- Create the GenMAPP Builder tables in PostgreSQL.
- Load files into PostgreSQL database via GenMAPP Builder.
- Export into a GenMAPP Gene Database.
- Inspect/vet/validate Gene Database.
- Prepare microarray data (organize, normalize, perform statistical analysis)
- Run GenMAPP using the Gene Database.
- Microarray data (import using Expression Dataset Manager)
- Run MAPPFinder analysis
- Place genes on MAPP and draw pathway
Results
This section will summarize the results of the project. This section will include figures, tables, and a narrative description of the results shown in those figures and tables. You should:
- Number each of the figures sequentially and number each of the tables sequentially in order from first mention in the text. You can either embed your figures and tables in the appropriate place in the text or put them all at the end. Do not mix both styles, however.
- Write a descriptive legend for each figure and table that briefly states what the figure/table is and gives a brief key to any labels and abbreviations.
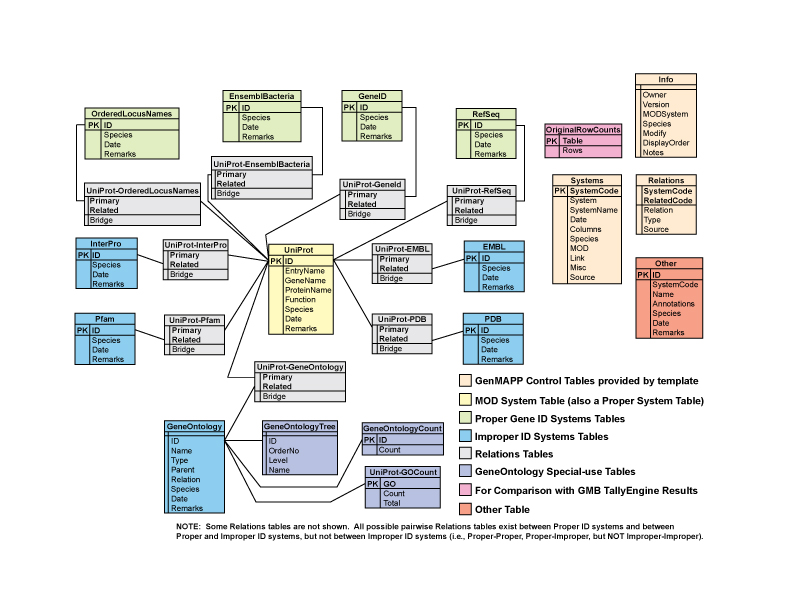
- Gene Database Schema figure
- Gene Database Testing Report on final version of Gene Database (can be put at the end of the report as an Appendix)
- A table that summarizes how many OrderedLocusNames IDs were found
- by XMLPipeDB match in the UniProt XML file
- by TallyEngine in the UniProt XML file
- by TallyEngine in the PostgreSQL database
- in the OriginalRowCounts table in the gdb
- in your external model organism database source
- Give the command used in match to generate these results
- Give the query used in PGAdmin III to generate these results
- Include a screenshot of the TallyEngine results as a figure
- Report on quantity and identity of gene IDs that did not make it into the database
- OrderedLocusNames IDs that were not in the XML source at all
- OrderedLocusNames IDs that were in the XML source but did not get imported into Postgres
- OrderedLocusNames IDs that were in Postgres but did not get exported to the GenMAPP Gene Database
- Report on what changes were made to the GenMAPP Builder code in order to to accommodate the second and third type of missing gene IDs and the result of those changes
- Report results of the DNA microarray analysis
- Include a table that shows the results of your "Sanity Check", i.e., how many genes were significantly increased and decreased at different p value cut-offs in the dataset?
- Include the criteria you used for a significant increase and decrease in expression for your GenMAPP Expression Dataset
- Table of filtered MAPPFinder results (from .xls or .xls)
- Show a list of 15-20 non-redundant GO terms.
- Include in your table the GO ID, the name of the GO term, the number changed/number present and the percent (e.g., 10/20 (50%)), the number present/number in GO and the percent, the regular p value and adjusted p value.
- Write a paragraph interpreting the GO results in light of the experiment performed in the published paper.
- GenMAPP MAPP of a pathway relevant to your results
Discussion
- How well did the GenMAPP Builder process work for your species (just comment on the technical aspects here, you will discuss the teamwork/process aspects in your individual assessment).
- Discuss the statistical analysis and MAPPFinder results for your microarray dataset. Compare it to what was reported in the original paper from which you got the microarray data.
- In particular, compare directly the log fold change value of a couple of key genes mentioned in the paper with what you found for those genes.
- Compare the criteria the journal article used for a significant expression change to the criteria that you used. How many genes met the criterion for the article vs. how many met the criterion for your analysis.
Conclusions
Write a concluding paragraph that summarizes the overall project and your findings.
- How closely do your findings correspond to the original study?
- Are there significant differences?
- Did you discover anything new?
- What future directions would you take if you were to continue this project?
Acknowledgments
Write a short paragraph acknowledging the assistance of anyone who is not a member of your team.
References
- This section lists all of the references cited in the text of the report (and only those references cited in the paper). Follow the Guidelines for Literature Citations in a Scientific Paper handout for general principles.
- Remember that you need to cite anything for which you are not the original source. Generally, in the introduction, you should aim for a minimum of two in-text citations per paragraph. You may reference the course web site using the appropriate format for a web reference.
- List your references in alphabetical order by first author using PeerJ’s recommended reference format. This format is very similar to APA style and should feel familiar if you have written research papers before.
- To minimize busy work, the PeerJ website includes links to downloadable style files for Zotero and EndNote, if you use either system for managing and rendering references.
PowerPoint Presentation
Each team of students will prepare and give a 20 minute PowerPoint presentation to report the results of their project on Tuesday, December 18 at 2:00-4:00 PM.
- Please follow the Presentation Guidelines for how to format your slides.
- You will need to prepare ~20 slides (assume 1 slide per minute of presentation) and include the following content:
- Background on your species and your species' genome from the genome paper presentation.
- The results of the Gene Database creation
- Gene Database Schema figure
- A table that summarizes how many OrderedLocusNames IDs were found
- by XMLPipeDB match in the UniProt XML file
- by TallyEngine in the UniProt XML file
- by TallyEngine in the PostgreSQL database
- in the OriginalRowCounts table in the gdb
- in your external model organism database source
- Give the command used in match to generate these results
- Give the query used in PGAdmin III to generate these results
- Include a screenshot of the TallyEngine results as a figure
- Report on quantity and identity of gene IDs that did not make it into the database
- OrderedLocusNames IDs that were not in the XML source at all
- OrderedLocusNames IDs that were in the XML source but did not get imported into Postgres
- OrderedLocusNames IDs that were in Postgres but did not get exported to the GenMAPP Gene Database
- Report on what changes were made to the GenMAPP Builder code in order to to accommodate the second and third type of missing gene IDs and the result of those changes
- Introduce the experiment performed in the microarray paper, including the experimental design flow chart
- Report results of the DNA microarray analysis
- Include a table that shows the results of your "Sanity Check", i.e., how many genes were significantly increased and decreased at different p value cut-offs in the dataset?
- Include the criteria you used for a significant increase and decrease in expression for your GenMAPP Expression Dataset
- Table of filtered MAPPFinder results (from .xls or .xls)
- Show a list of 15-20 non-redundant GO terms.
- Include in your table the GO ID, the name of the GO term, the number changed/number present and the percent (e.g., 10/20 (50%)), the number present/number in GO and the percent, the regular p value and adjusted p value.
- GenMAPP MAPP of a pathway relevant to your results
- Your PowerPoint slides must be uploaded to the wiki and linked to from your individual journal page and your team page by midnight, Tuesday, December 15.
- You can update your slides before your presentation, but we will be grading the ones you upload by the deadline.
- Your presentation (both the slides and the oral presentation) will be evaluated by the instructors using the Presentation Rubric.
- Your presentation will also be evaluated by your fellow classmates (anonymously) who will answer the following questions:
- What is the speaker's take-home message (one short sentence)?
- What are the best points about the presentation's organization, visuals, and delivery? Please give at least 2 specific examples.
- What points need improvement? Please give at least 2 specific examples.
- We expect that you will take the feedback from your previous presentation into account when doing this presentation.
Group Files and Datasets
- GenMAPP Gene Database for assigned species (.gdb)
- ReadMe file to accompany the Gene Database (.pdf)
- Sample ReadMe in Word format: ReadMe_Vc-Std_External_20131122.zip
- Sample ReadMe in markdown (a work in progress)
- Include Gene Database Schema diagram in ReadMe
- Sample schema in Adobe Illustrator format: GenMAPP_schema_generic_bacteria_20151210.zip
- Sample schema in jpeg format: GenMAPP_schema_generic_bacteria_20151210.jpg
- Gene Database Testing Report for final submitted Gene Database (print from wiki to .pdf file)
- Processed and analyzed DNA microarray dataset (.xls or .xlsx)
- Data file used for import into GenMAPP (.txt or .csv)
- GenMAPP Expression Dataset file (.gex)
- Exceptions file of data imported into GenMAPP (.EX.txt)
- Raw MAPPFinder results files (-GO.txt)
- .gmf file
- Filtered MAPPFinder Results (.xls or .xlsx)
- Sample MAPP file of a relevant biological pathway for your species (.mapp)
- Group Report describing the creation of the Gene Database and the biological analysis of the data (.doc, .docx, or .pdf)
- PowerPoint presentation (.ppt, .pptx, or .pdf, given on Tuesday, December 15)
Individual Assessment and Reflection
Each person on the team will complete an assessment and reflection individually. If you are comfortable with making this assessment publicly available, you may write it up as a wiki page or as a Word document uploaded to your group deliveables page. If you prefer to communicate your assessment privately, then email this to both Drs. Dahlquist and Dionisio.
Statement of Work
- Describe exactly what you did on the project.
- Provide references or links to artifacts of your work, such as:
- Wiki pages
- Other files or documents
- Code or scripts
Assessment of Project
- Give an objective assessment of the success of your project workflow and teamwork.
- What worked and what didn't work?
- What would you do differently if you could do it all over again?
- Evaluate the Gene Database Project and Group Report in the following areas:
- Content: What is the quality of the work?
- Organization: Comment on the organization of the project and of your group's wiki pages.
- Completeness: Did your team achieve all of the project objectives? Why or why not?
Reflection on the Process
- What did you learn?
- With your head (biological or computer science principles)
- With your heart (personal qualities and teamwork qualities that make things work or not work)?
- With your hands (technical skills)?
- What lesson will you take away from this project that you will still use a year from now?
| Gene Database Project Links | |||||||
|---|---|---|---|---|---|---|---|
| Overview | Deliverables | Reference Format | Guilds | Project Manager | GenMAPP User | Quality Assurance | Coder |
| Teams | Heavy Metal HaterZ | The Class Whoopers | GÉNialOMICS | Oregon Trail Survivors | |||