Laurmagee: Week 15
From LMU BioDB 2013
Statistical Analysis
- Open the following spreadsheet File:Compiled Ratios and Logs.xls from Laurmagee: Week 13.
- Begin a new workbook and copy over the Gene ID column into cell A1. Then in the subsequent columns, copy over the log values found in your previous sheet. Order all the different time periods in increasing intervals and sort the replicants at each time in increasing order as well. After this pasting has been done, your column titles across the top of the worksheet will say "Gene ID", "log_700S1-t15", "log_700S2-t15", "log_700S3-t15"... and so on for t30, t60, and t240.
- Begin scaling and centering the data by first inserting a new worksheet in Excel labeled "scaled_centered".
- Select and copy all of the data from your original worksheet. Then paste it into cell A1 in new worksheet.
- Insert two rows in between the top row of headers and the first data row. In cell A2, type "Average" and in cell A3, type "StdDev".
- You will now compute the Average log ratio for replicant and time period.
- In cell B2, type the following equation:
=AVERAGE(B4:B5224) and press "Enter".
- Excel is computing the average value of the cells specified in the range given inside the parentheses. Instead of typing the cell designations, you can click on the beginning cell, scroll down to the bottom of the worksheet, and shift-click on the ending cell.
- You will now compute the Standard Deviation of the log ratios on each chip (each column of data). In cell B3, type the following equation:
=STDEV(B4:B5224) and press "Enter".
- Excel will now do some work for you. Copy these two equations (cells B2 and B3) and paste them into the empty cells in the rest of the columns. Excel will automatically change the equation to match the cell designations for those columns.
You have now computed the average and standard deviation of the log ratios for replicant and time period.
- Copy the column headings for all of your data columns and then paste them to the right of the last data column so that you have a second set of headers above blank colums of cells. Edit the names of the columns so that they now read: log_700S1-t15_scaled_centered, log_700S2-t15_scaled_centered, etc.
- In cell N4, type the following equation:
=(B4-B$2)/B$3
- In this case, we want the data in cell B4 to have the average subtracted from it (cell B2) and be divided by the standard deviation (cell B3). We use the dollar sign symbols in front of the "2" and "3" to tell Excel to always reference that row in the equation, even though we will paste it for the entire column.
- Copy and paste this equation into the entire column.
- Copy and paste the scaling and centering equation for each of the columns of data with the "_scaled_centered" column header. Be sure that your equation is correct for the column you are calculating.
- Insert a new worksheet and name it "statistics".
- Go back to the "scaling_centering" worksheet and copy the first column ("ID").
- Paste the data into the first column of your new "statistics" worksheet.
- Go back to the "scaling_centering" worksheet and copy the columns that are designated "_scaled_centered".
- Go to your new worksheet and click on the B1 cell. Select "Paste Special" from the Edit menu. A window will open: click on the radio button for "Values" and click OK. This will paste the numerical result into your new worksheet instead of the equation which must make calculations on the fly.
- Go to a new column on the right of your worksheet. Type the header "Avg_LogFC_t15", "Avg_LogFC_t30", "Avg_LogFC_60", and "Avg_LogFC_240" into the top cell of the next four columns.
- Compute the average log fold change for the replicates for each patient by typing the equation:
=AVERAGE(B2:D2) into cell N2. Copy this equation and paste it into the rest of the column.
- Create the equation for times t30, t60, and t240 and paste it into their respective columns.
- Label the next four columns "Tstat_t15", "Tstat_t30", "Tstat_t60", and "Tstat_t240". This will compute a T statistic that tells us whether the scaled and centered average log ratio is significantly different than 0 (no change). Enter the equation:
=N2/(STDEV(B2:D2)/SQRT(3))
- (NOTE: in this case the number of replicates is 3. Be careful that you are using the correct number of parentheses.) Copy the equation and paste it into all rows in that column as well as the next three column making sure to change the cells involved in the equation accordingly.
- Label the top cell in the next four columns "Pvalue_t15", "Pvalue_t30", "Pvalue_t60", and "Pvalue_t240". In the cell below the label, enter the equation:
=TDIST(ABS(R2),2, 2)
- The number of degrees of freedom is the number of replicates minus one, so in our case there are 2 degrees of freedom. Copy the equation and paste it into all rows in that column and the next three columns making sure to change the cell involved to the appropriate Tstat value.
- Insert a new worksheet and name it "forGenMAPP".
- Go back to the "statistics" worksheet and Select All and Copy.
- Go to your new sheet and click on cell A1 and select Paste Special, click on the Values radio button, and click OK. We will now format this worksheet for import into GenMAPP.
- Select Columns B through Q (all the fold changes). Select the menu item Format > Cells. Under the number tab, select 2 decimal places. Click OK.
- Select Columns R and Z. Select the menu item Format > Cells. Under the number tab, select 4 decimal places. Click OK.
- Select Columns N through Z and Cut. Select Column B by left-clicking on the "B" at the top of the column. Then right-click on the Column B header and select "Insert Cut Cells". This will insert the data without writing over your existing columns.
- Delete Rows 2 and 3 where it says "Average" and "StDev" so that your data rows with gene IDs are immediately below the header row 1.
- Insert a column to the right of the "ID" column. Type the header "SystemCode" into the top cell of this column. Fill the entire column (each cell) with the letter "N".
- Select the menu item File > Save As, and choose "Text (Tab-delimited) (*.txt)" from the file type drop-down menu. Excel will make you click through a couple of warnings because it doesn't like you going all independent and choosing a different file type than the native .xls. This is OK. Your new *.txt file is now ready for import into GenMAPP.
- File:SinorhizobiumMeliloti LM GenMapp DataSheet.xls
Sanity Check
- How many genes have p value < 0.05 for the time set of 15 minutes?
- 3613 genes
- How many genes have p value < 0.05 for the time set of 30 minutes?
- 5225 genes
- How many genes have p value < 0.05 for the time set of 60 minutes?
- 5207 genes
- How many genes have p value < 0.05 for the time set of 240 minutes?
- 6790 genes
- How many genes have p value < 0.01 for the time set of 15 minutes?
- 907 genes
- How many genes have p value < 0.01 for the time set of 30 minutes?
- 1518 genes
- How many genes have p value < 0.01 for the time set of 60 minutes?
- 1553 genes
- How many genes have p value < 0.01 for the time set of 240 minutes?
- 2437 genes
- How many genes have p value < 0.001 for the time set of 15 minutes?
- 92 genes
- How many genes have p value < 0.001 for the time set of 30 minutes?
- 179 genes
- How many genes have p value < 0.001 for the time set of 60 minutes?
- 172 genes
- How many genes have p value < 0.001 for the time set of 240 minutes?
- 347 genes
- How many genes have p value < 0.0001 for the time set of 15 minutes?
- 7 genes
- How many genes have p value < 0.0001 for the time set of 30 minutes?
- 15 genes
- How many genes have p value < 0.0001 for the time set of 60 minutes?
- 13 genes
- How many genes have p value < 0.0001 for the time set of 240 minutes?
- 36 genes
- Keeping the "Pvalue" filter at p < 0.05, filter the "Avg_LogFC_all" column to show all genes with an average log fold change greater than zero. How many are there for the time set of 15 minutes?
- 1521 genes
- Keeping the "Pvalue" filter at p < 0.05, filter the "Avg_LogFC_all" column to show all genes with an average log fold change greater than zero. How many are there for the time set of 30 minutes?
- 1926 genes
- Keeping the "Pvalue" filter at p < 0.05, filter the "Avg_LogFC_all" column to show all genes with an average log fold change greater than zero. How many are there for the time set of 60 minutes?
- 2194 genes
- Keeping the "Pvalue" filter at p < 0.05, filter the "Avg_LogFC_all" column to show all genes with an average log fold change greater than zero. How many are there for the time set of 240 minutes?
- 2846 genes
- Keeping the "Pvalue" filter at p < 0.05, filter the "Avg_LogFC_all" column to show all genes with an average log fold change less than zero. How many are there for the time set of 15 minutes?
- 2092 genes
- Keeping the "Pvalue" filter at p < 0.05, filter the "Avg_LogFC_all" column to show all genes with an average log fold change less than zero. How many are there for the time set of 30 minutes?
- 3299 genes
- Keeping the "Pvalue" filter at p < 0.05, filter the "Avg_LogFC_all" column to show all genes with an average log fold change less than zero. How many are there for the time set of 60 minutes?
- 3013 genes
- Keeping the "Pvalue" filter at p < 0.05, filter the "Avg_LogFC_all" column to show all genes with an average log fold change less than zero. How many are there for the time set of 240 minutes?
- 3944 genes
- What about an average log fold change of > 0.25 and p < 0.05 for the time set of 15 minutes?
- 1476 genes
- What about an average log fold change of > 0.25 and p < 0.05 for the time set of 30 minutes?
- 1890 genes
- What about an average log fold change of > 0.25 and p < 0.05 for the time set of 60 minutes?
- 2129 genes
- What about an average log fold change of > 0.25 and p < 0.05 for the time set of 240 minutes?
- 2763 genes
- Or an average log fold change of < -0.25 and p < 0.05 for the time set of 15 minutes?
- 2052 genes
- Or an average log fold change of < -0.25 and p < 0.05 for the time set of 30 minutes?
- 3256 genes
- Or an average log fold change of < -0.25 and p < 0.05 for the time set of 60 minutes?
- 2942 genes
- Or an average log fold change of < -0.25 and p < 0.05 for the time set of 240 minutes?
- 3866 genes
GenMAPP and MAPPFinder Protocols
- To begin GenMAPP analysis, first launch GenMAPP 2 or download it off of the following website: http://genmapp.org.
- Look at the lower-left hand corner to see what gene database is loaded. For this assignment, the gene database is Media:Sinorhizobium_meliloti_1021_mpetredi_2013123-2.gdb should appear in the corner.
- If another database appears or if there is "No Gene Database", go to Data > Choose Gene Database and find the database you need to use.
- Once the correct database is loaded, go to Data > Expression Dataset Manager. This will allow you to input the data file created in the "Statistical Analysis" portion of this page.
- In the window that pops up, go to Expression Datasets > New Dataset and open the tab-delimited file you created for GenMAPP: Media:SinorhizobiumMeliloti_LM_GenMapp_DataSheet.txt
- In the "Data Type Specification" window that pops up, only check the box next to a column header if that column has character data. All of the boxes should remain unchecked, because none of the columns in our dataset contain non-numerical values.
- Give the Expression Dataset Manager time to convert your data into a GEX file.
- An error message may appear that states that the Expression Dataset Manager was unable to convert some of the lines of the data. These lines of data are not incorporated into the Expression Dataset but rather recorded in an exception file that contains all of your raw data and an additional column called ~Error~.
- The exception file is a tab-delimited file with the suffix .EX appended to the name of the raw data file you loaded into the Expression Dataset Manager.
- Open the the exception file in Excel and filter the data to note what errors have been recorded.
- Using the .gdb Gene Database created by my partners, there were 5,538 errors, each of which was "Gene not found in OrderedLocusNames or any related system."
- Customize the new Expression Dataset by creating Color Sets, which contain the instructions to GenMAPP for displaying data on MAPPs.
- In the "Color Sets" section, type in your own title into the "Name" field.
- To specify what value appears next to each gene on a MAPP, select "Avg_LogFC_t15" in the drop down menu in the "Gene Value" field.
- We are using the t15 time period for this step to represent the results from all four time intervals, because it would be too challenging to complete this protocol with all four time interval values.
- In the "Criteria Builder" section, click on the "New" button. Now, we will construct the criterion to query the data.
- We will set the criterion to query for all the genes that have a significant (i.e. [Pvalue] < 0.05) decrease in the average log fold change (i.e. [Avg_LogFC_t15] < -0.25).
- In the menu under "Columns" in the "Criteria Builder" section, select "Avg_LogFC_t240", which will then appear in the "Criterion" field.
- Then choose the "<", ">", and "=" as appropriate, paired with -0.25.
- Type out the word "AND" in this same field and select "Pvalue_t15" and the "Ops" accordingly. .
- Under "Ops", click on the "<" operator. Then, type 0.05 (this will appear in the "Criterion" field).
- Enter the name for the criterion in the "Label in Legend" field "Decreased", as we are looking for the Avg_LogFC that have decreased.
- Choose a color for the criterion by left-clicking on the box next to "Color". Choose a color from the Color window that appears and click OK. In this experiment, the color red was chosen.
- You may now click the "Add" button.
- Now we will add another criterion. In the "Criteria Builder" section, click on the "New" button. Now, we will construct the criterion to query the data.
- We will set the criterion to query for all the genes that have a significant (i.e. [Pvalue] < 0.05) decrease in the average log fold change (i.e. [Avg_LogFC_t15] > 0.25).
- In the menu under "Columns" in the "Criteria Builder" section, select "Avg_LogFC_t240", which will then appear in the "Criterion" field.
- Then choose the "<", ">", and "=" as appropriate, paired with 0.25.
- Type out the word "AND" in this same field and select "Pvalue_t15" and the "Ops" accordingly. .
- Under "Ops", click on the "<" operator. Then, type 0.05 (this will appear in the "Criterion" field).
- Enter the name for the criterion in the "Label in Legend" field "Increased", as we are looking for the Avg_LogFC that have increased.
- Choose a color for the criterion by left-clicking on the box next to "Color". Choose a color from the Color window that appears and click OK. In this experiment, the color green was chosen.
- You may now click the "Add" button.
- Save the entire Expression Dataset by going to Expression Datasets > Save.
- Exit the Expression Dataset to view the Color Sets on a MAPP.
- Media:ColorSets.mapp
- Moving onto the MAPPFinder Protocol, we will stay in GenMAPP, but selected Tools > MAPPFinder.
- Click on the button "Calculate New Results" and then choose the "Find File" button on the page to load your GEX file: Media:SinorhizobiumMeliloti_LM_GenMapp_FinalFile.gex
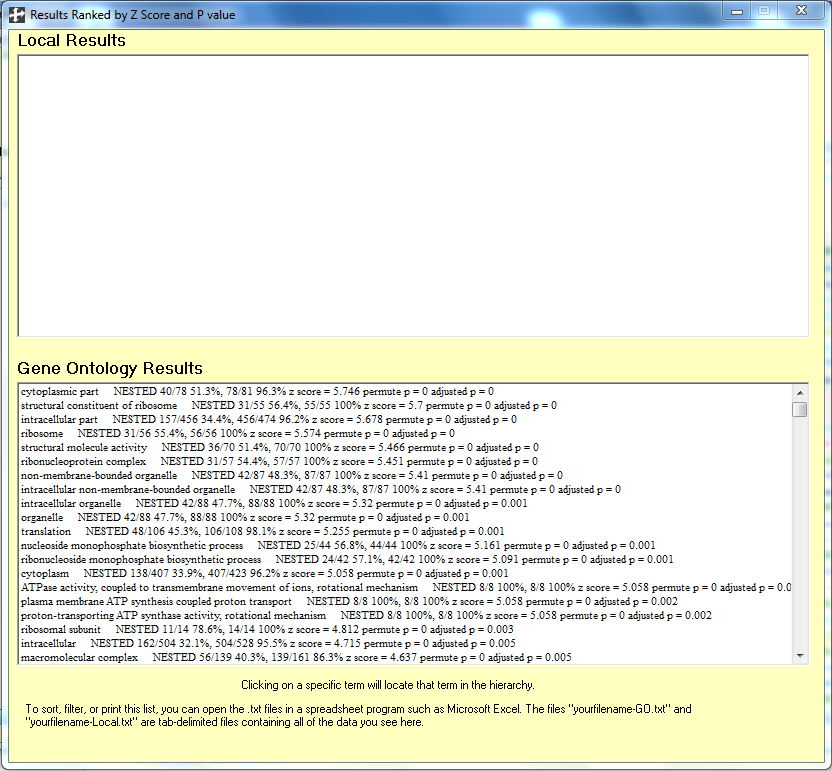
- Choose the Color Set and Criteria with which to filter the data. Click on "Decreased" criteria in the right-hand box then check the two boxes labeled "Gene Ontology" and "p value".
- Then "Browse" through your computer and create a meaningful filename for the project.
- Now you can hit "Run MAPPFinder".
- It will take a while for this process to finish, but a Gene Ontology browsers with open showing your results when it has been completed.
- To see a list of the most significant Gene Ontology terms, click on the menu item "Show Ranked List".
- The top twenty go terms are listed in the following image:
- In Windows, make a copy of the results file and open it in Excel.
- Click on a cell in the row of headers. On the tool bar, select Sort & Filter > Filter. Set the following filters:
- Z Score greater than 2
- Permute P less than 0.05
- Number Changed greater than or equal to 5 and less than 100.
- Percent Changed greater than or equal to 25
- 108 results found
- Save the file as a different Excel spreadsheet name by selecting File > Save As and select Excel workbook (.xls) from the drop-down menu.
- Now look at the "Increased" data. We will stay in GenMAPP, but selected Tools > MAPPFinder.
- Click on the button "Calculate New Results" and then choose the "Find File" button on the page to load your GEX file: Media:SinorhizobiumMeliloti_LM_GenMapp_FinalFile.gex
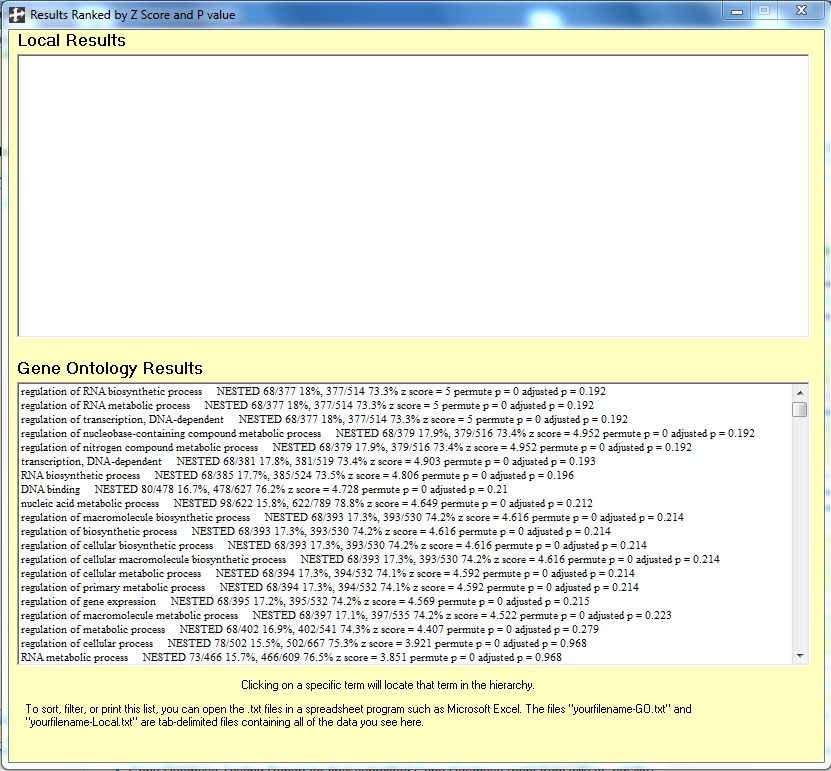
- Choose the Color Set and Criteria with which to filter the data. Click on "Increased" criteria in the right-hand box then check the two boxes labeled "Gene Ontology" and "p value".
- Then "Browse" through your computer and create a meaningful filename for the project.
- Now you can hit "Run MAPPFinder".
- It will take a while for this process to finish, but a Gene Ontology browsers with open showing your results when it has been completed.
- To see a list of the most significant Gene Ontology terms, click on the menu item "Show Ranked List".
- The top twenty go terms are listed in the following image:
- In Windows, make a copy of the results file and open it in Excel.
- Click on a cell in the row of headers. On the tool bar, select Sort & Filter > Filter. Set the following filters:
- Z Score greater than 2
- PermuteP less than .05
- Number Changed greater than or equal to 5 and less than 100
- Percent Changed greater than or equal to 25
- 6 results found
- Save the file as a different Excel spreadsheet name by selecting File > Save As and select Excel workbook (.xls) from the drop-down menu.

